Many of our home equity lenders ask us this question. Of course, the challenge is not just reducing cost per loan. The challenge is doing so while continuing to underwrite high quality performing loans. A great strategy for achieving this goal starts with analyzing your current title and valuation costs across your entire lending footprint.
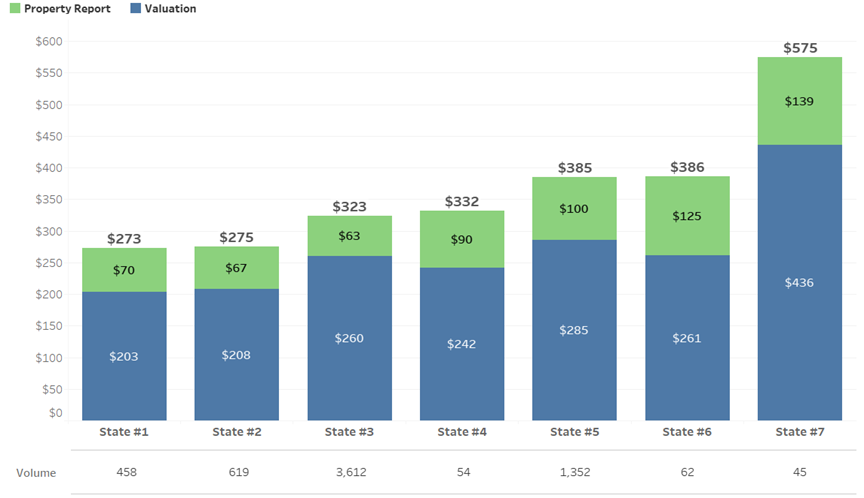
The chart below demonstrates how CSS illustrated this data for one of its lender customers across their seven state lending footprint:
Average PR and Valuation Spend Loan:
Q1-Q3 2020
To put this data to work, it should be expressed in an annualized format as follows:
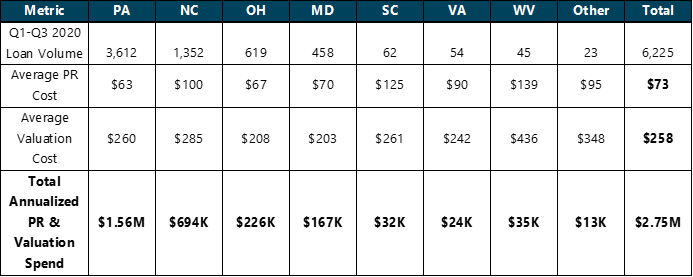
After this has been accomplished, the Property Report and Valuation spends should be analyzed separately to determine potential strategies for cost reduction.
Valuation Costs:
An analysis of average valuation spend disclosed a variation by state depending on the product mix used as shown in the chart below. The product mix was based on a variety of loan underwriting criteria established by the lender.
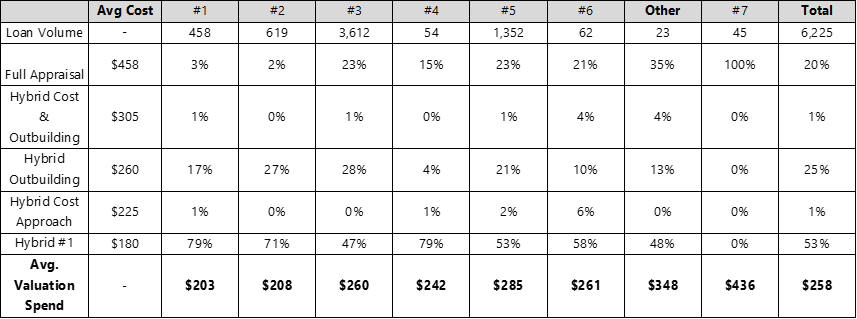
Not surprisingly, states with the highest percentage of loans utilizing full appraisals had the highest cost per loan. The key to reducing cost per loan is assigning the appropriate loan product to the highest percent of loans. As a result of accumulating this data, CSS was able to suggest the following strategies to lower valuation costs:
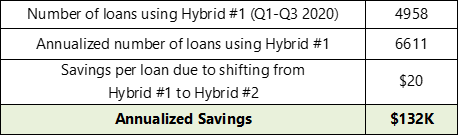
- Replace lower-end loans with a hybrid loan product that cost $20 less than the current product being used, with comparable result:
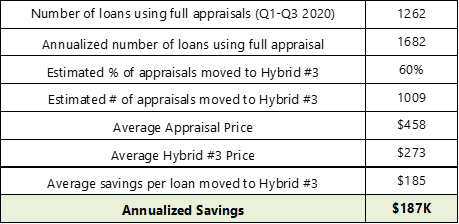
- Add another high performing hybrid loan product to the mix prior to moving to a full appraisal.
- Review existing increased underwriting requirements for Cost Approach and Outbuilding inspections. Upon doing so, it was discovered that these increased underwriting requirements were not necessary on 2080 orders annually. As a result, the Hybrid #2 base product could be used for these loans. This avoided the additional $80 per loan associated with the enhanced cost approach valuation and outbuilding inspections providing annual cost savings of $166K!
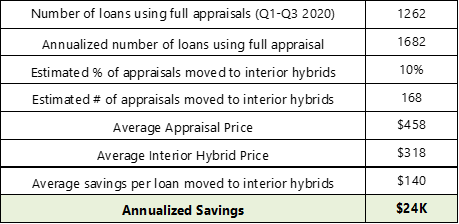
- Add interior inspection hybrid products to the product mix prior to selecting a full appraisal:
- Add 2055’s – Drive By Appraisals to the product mix prior to moving to a full appraisal. It was determined this could be done on 10% of the loans resulting in the following annual savings:
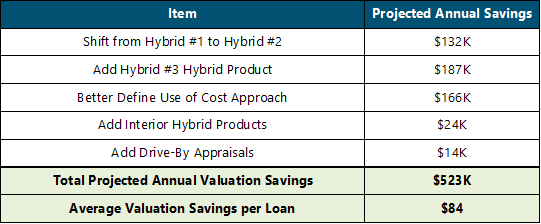
If all of the strategies were adopted by the lender, the following annual savings would result:
Property Reports:
- The primary driver of PR price differences are variations in search costs across the different states and counties of the lending footprint due to abstractor concentration, availability of online vs. physical county records, cities vs. rural counties, etc. Attorney state requirements also impact pricing as some such states require attorney certification of search results.
- Other factors may include specific underwriting requirements of the lender. These factors should be reviewed to determine the continued value and cost of each internal requirement.
Potential Solutions:
- In this case, PR costs varied widely across the states comprising the lending footprint.
- This resulted for many of the reasons suggested above and as a result of states being added to the lender’s market footprint over many years.
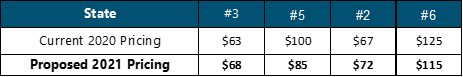
- As a result of this analysis, costs were standardized across the various states resulting in reduced costs per loan in the lender’s growth market, State #2:
PRICING:
OVERALL SPEND:
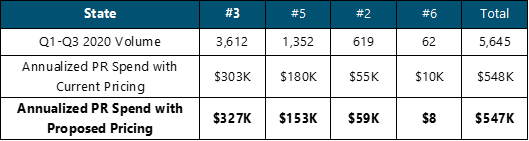
While this action resulted in a wash for current annual spending, it positioned the lender for future savings as per loan costs were reduced in the state with the greatest volume growth potential.
Property Report Errors & Omissions Coverage: CSS offers our home equity lender customers E & O coverage on the Property Reports we produce. Coverage may be obtained at two levels, $50,000 or $500,000. The $500,000 also provides protection against claims arising in the “gap period”, the time between the date of the Property Report and recording of the mortgage securing the home equity loan.
The lender in the above example had selected the $50,000 coverage for an additional $4 per loan. The $500,000 coverage cost was $12 per loan. The lender inquired whether it made sense to eliminate this coverage in an effort to reduce overall loan costs? We recommended the that the lender not eliminate this coverage for several reasons:
- Based on their loan volume, eliminating this coverage would only provide annual savings of $41,000;
- Although claims history is low given the quality of the Property Report searches, errors do occur and a single claim could easily wipe-out the projected annual savings; and
- Our experience has been that all of our home equity lending customers maintain $500,000 of E & O coverage. So, electing to eliminate coverage would be contrary to industry norms for safe and sound underwriting practices.